Reading the H–R diagram
AC9S10U03 AC9S10I05
By the end of this lesson you should be able to
- Read the temperature and luminosity of a star from an H–R diagram, including the reversed temperature axis and the log scale.
- Link a star's colour to its surface temperature.
- Identify main-sequence stars, giants, supergiants and white dwarfs on the diagram.
- Use the diagram to describe how a star changes as it ages.
Hook
Look at the night sky and every star is just a dot. Some dots are bright, some are faint, some are a little red, some a little blue. Can a dot tell you how old a star is, how big it is, or how it will die?
Around 1910, two astronomers, Ejnar Hertzsprung in Denmark and Henry Norris Russell in the USA, each plotted stars on a graph of brightness against temperature. They expected a random scatter. Instead, the stars fell into clear groups. That graph, the H–R diagram, is now the most important graph in astronomy.
Quick poll: a star that is very bright and cool. Should it be big or small? Vote, then we will find out.
Watch: Stars: Crash Course Astronomy #26 · Crash Course
Reading the axes
An H–R diagram is a scatter graph. Each dot is one star. It has four axes, but they only measure two things: how hot the star's surface is, and how bright the star really is.
How hot (read across):
- Top axis: surface temperature in kelvin (K). Watch out: it runs backwards. Hot is on the left, cool is on the right.
- Bottom axis: spectral class, the letters O, B, A, F, G, K and M. Astronomers sort stars into classes using the dark lines in their spectra. O stars are the hottest and M stars the coolest. The Sun is a G star. (A way to remember the order: Oh Be A Fine Girl/Guy, Kiss Me.)
How bright (read up and down):
- Right axis: luminosity, the total energy a star gives out each second, compared with the Sun (Sun = 1). A star with luminosity 100 gives out 100 times as much energy as the Sun. The axis uses a log scale: each gridline is 10 times the one below.
- Left axis: absolute magnitude, another way of measuring how bright a star really is. Watch out again: it also runs backwards. A smaller number means brighter, and the brightest stars have negative magnitudes. The Sun is about +5. Every 5 magnitudes is a factor of 100 in luminosity.
Temperature also sets a star's colour. The hottest stars (above about 10 000 K) look blue-white, the Sun (about 5800 K) looks yellow-white, and cool stars (about 3000 K) look orange-red. The background colour of the diagram shows this: blue on the left, yellow in the middle, red on the right.
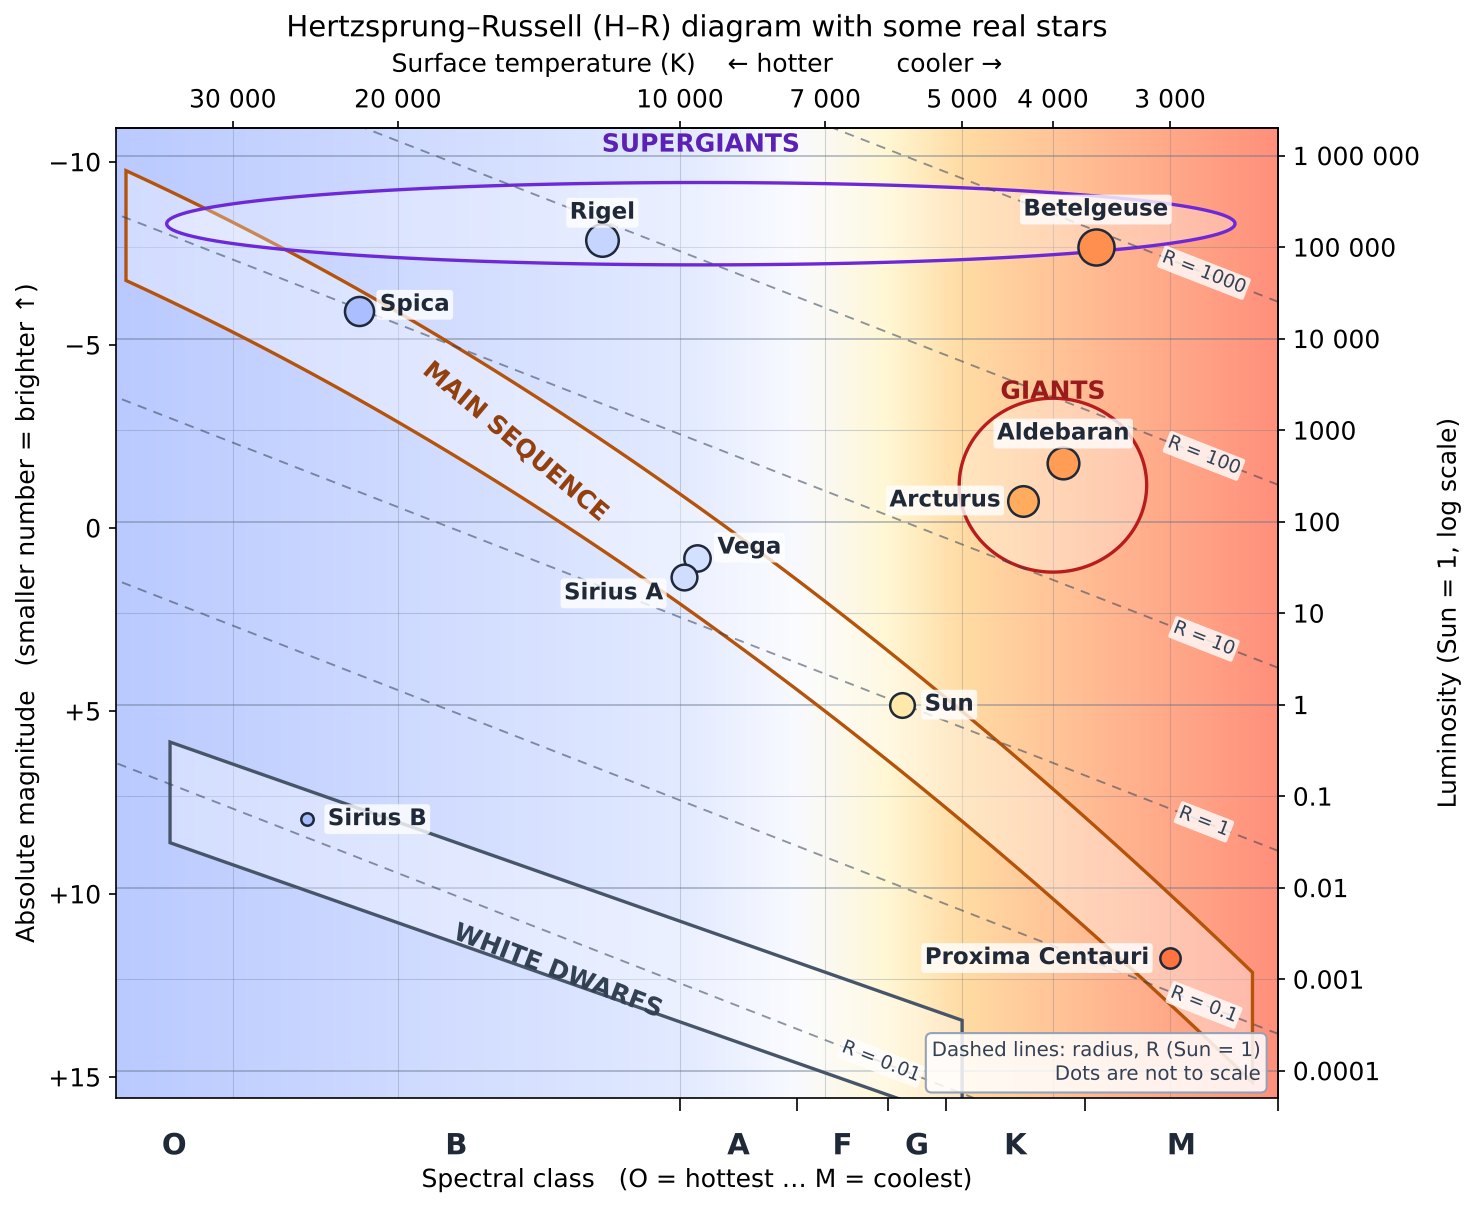
Key idea: always read the axes and their units first. Top = brighter, bottom = dimmer, left = hotter, right = cooler. Temperature and spectral class are two scales for the same thing (how hot). Luminosity and absolute magnitude are two scales for the same thing (how bright).
A diagram used by astronomers. Here is the H–R diagram from CSIRO's Australia Telescope National Facility. It has the same four axes in the same places. Find the main sequence, the giants, the supergiants and the white dwarfs, then find three stars that are also on the diagram above. Do they sit in about the same places?

Worked example: reading Vega
Use the diagram to describe Vega's temperature and luminosity, compared with the Sun.
Temperature: Vega sits just to the right of the 10 000 K line, so about 9000–10 000 K. On the bottom axis that is spectral class A. That is hotter than the Sun (about 5800 K), so Vega looks blue-white.
Luminosity: it sits between the 10 and 100 gridlines on the right axis, nearer 100 (the scale is logarithmic), so about 40 times the Sun. On the left axis that is an absolute magnitude of about +1, brighter than the Sun's +5.
Group: it is on the main-sequence band, so it is fusing hydrogen in its core like the Sun.
The main sequence
About 90% of stars lie on a band running from top left to bottom right. This is the main sequence: stars that are fusing hydrogen into helium in their cores. A star spends most of its life here.
- Top left: hot, bright, blue stars (like Spica). These have the most mass. They burn their fuel fast and live only millions of years.
- Middle: stars like the Sun, which will spend about 10 billion years here.
- Bottom right: cool, dim red dwarfs (like Proxima Centauri, the nearest star to the Sun). They have the least mass and use fuel so slowly they can last for trillions of years, much longer than the universe has existed.
Key idea: along the main sequence, mass decides everything. More mass → hotter, brighter, shorter life. Less mass → cooler, dimmer, longer life.
Giants, supergiants and white dwarfs
Stars off the main sequence are mostly stars near the end of their lives.
- Giants (upper right): cool but bright. A cool surface gives out little light per square metre, so to be this bright they must be huge. Aldebaran is about 45 times as wide as the Sun.
- Supergiants (along the top): the brightest stars of all, such as Rigel (blue-white) and Betelgeuse (red). They are massive stars late in life, heading for a supernova.
- White dwarfs (lower left): hot but very dim, so they must be tiny, about the size of Earth. Sirius B, the faint partner of the bright star Sirius A, is one. It is the leftover core of a dead star.
So you can work out size from position: bright + cool = big; dim + hot = small.
The dashed diagonal lines on the diagram show this directly. Each line joins all the places where a star would have the same radius (R), compared with the Sun (R = 1). Stars get bigger towards the top right and smaller towards the bottom left. Betelgeuse sits near the R = 1000 line; Sirius B sits near the R = 0.01 line.
The dots are bigger for bigger stars, but they are not to scale. Drawn to scale, Betelgeuse's dot would be about 100 000 times wider than Sirius B's.
Stars move on the diagram
A star does not stay at one spot. As it ages, its temperature and luminosity change, so its dot moves. Here is the Sun's future, matching the life cycle from last lesson.

This animation from the European Space Agency was made by plotting real stars measured by the Gaia space telescope, then picking out the ones with the same mass and make-up as the Sun at different ages. The Sun is about 4.6 billion years old now; it will be at its hottest at about 8 billion years, and become a red giant at about 10–11 billion years.
- In about 5 to 6 billion years the Sun leaves the main sequence and moves up and right: it becomes a cooler, much brighter red giant.
- It throws off its outer layers (a planetary nebula), exposing its very hot core: the dot jumps to the left.
- The core becomes a white dwarf and drops to the bottom left.
- With no fusion, the white dwarf slowly cools and fades, moving down and right for billions of years.
Star detective: read five stars
Use the H–R diagram in section 1. Copy and complete this table for Rigel, Sirius B, Proxima Centauri, Arcturus and Spica.
| Star | Temperature range (K) | Brighter or dimmer than the Sun? About how many times? | Colour | Group | What it will become (or what it was) |
|---|---|---|---|---|---|
| Rigel | |||||
| Sirius B | |||||
| Proxima Centauri | |||||
| Arcturus | |||||
| Spica |
Show answers
Readings from a diagram are approximate: anything close to these values is fine.
| Star | Temperature range (K) | Brighter or dimmer than the Sun? About how many times? | Colour | Group | What it will become (or what it was) |
|---|---|---|---|---|---|
| Rigel | 10 000–20 000 (about 12 000) | Brighter, about 100 000 times | Blue-white | Supergiant | Will explode as a supernova, leaving a neutron star or black hole |
| Sirius B | 20 000–30 000 (about 25 000) | Dimmer, about 0.05 of the Sun (about 20 times dimmer) | Blue-white | White dwarf | Was once a main-sequence star more massive than the Sun; will slowly cool and fade |
| Proxima Centauri | About 3000 | Dimmer, about 0.002 of the Sun (hundreds of times dimmer) | Red | Main sequence (red dwarf) | Will stay on the main sequence for trillions of years, then slowly become a white dwarf |
| Arcturus | 4000–5000 (about 4300) | Brighter, about 100–200 times | Orange | Giant | Will lose its outer layers and become a white dwarf |
| Spica | 20 000–30 000 (about 22 000) | Brighter, about 10 000–20 000 times | Blue | Main sequence (top end) | Massive enough to end in a supernova |
Try it
Size from position. Betelgeuse and Proxima Centauri are both red, with similar temperatures (3000–3600 K). Predict first: how can one be about 100 000 times brighter than the Sun and the other about 600 times dimmer, if their surfaces are about equally hot? (Hint: think about how much glowing surface each star has.)
Then test it in the H–R Diagram Explorer.
- Explore: drag the cross onto Betelgeuse and look at the size panel. Then drag it straight down to Proxima Centauri. What happens to the size? What stays the same?
- The Sun's future: press Play and watch how the Sun's size changes at each stage.
- Find it: try the five self-check questions. Aim to get every one first time.
- Extra: under the diagram, change Plotted stars to nearest stars, then to brightest in our sky. What kind of star are most of our nearest neighbours? Why are the brightest stars in our sky mostly not like them?
H–R Diagram Explorer: original interactive for kugelblitz.me, based on the idea of the University of Nebraska–Lincoln explorer. Open it in a new tab for a bigger view.
NAAP H–R Diagram Explorer (University of Nebraska–Lincoln) · Crash Course Astronomy #26: Stars
Guided example
A star is measured at about 4000 K with a luminosity of about 300 times the Sun. Where would it sit on the H–R diagram, what group is it in, and what can you say about its size?
Show answer
Step 1, temperature (top axis): 4000 K is on the right-hand (cool) side, in spectral class K, so it looks orange.
Step 2, luminosity (right axis): 300 is between the 100 and 1000 gridlines, about halfway on the log scale. It is much brighter than the Sun.
Step 3, group: cool and bright puts it in the upper right, in the giant region (a main-sequence star at 4000 K would be dimmer than the Sun).
Step 4, size: a cool surface gives out less light per square metre than the Sun, so to be 300 times brighter it must have a much larger surface. It sits between the R = 10 and R = 100 lines, so it is a giant, a few tens of times wider than the Sun.
Self-check
How this works
Pick an answer to get feedback. Nothing is saved or sent anywhere; this is just for you.
1.
On an H–R diagram, where are the hottest stars found?
Explanation
x-axis: surface temperature, hot on the left. y-axis: luminosity, bright at the top.
2.
A star sits in the lower left of an H–R diagram: about 15 000 K and 0.01 times the Sun's luminosity. What is it?
Explanation
Hot + dim = small = white dwarf (lower left). Cool + bright = big = giant or supergiant (upper right).
3.
Which statement about main-sequence stars is correct?
Explanation
Along the main sequence, mass decides position. The more massive a star, the hotter, brighter and higher up the band it is, and the faster it uses its fuel.
4.
As the Sun becomes a red giant, how will its dot move on the H–R diagram?
Explanation
Sun's future path: main sequence → up and right (red giant) → left (outer layers lost) → down to the bottom left (white dwarf) → slowly fades.
Exam skill: Reading data from an H–R diagram
What a full answer includes
- Read the axes, with units: temperature (K, hot on the left) and luminosity (Sun = 1, log scale) or absolute magnitude (smaller = brighter)
- Give values or ranges read from the diagram, not just "hot" or "bright"
- Compare with the Sun (about 5800 K, luminosity 1): how many times brighter or dimmer?
- Name the group: main sequence, giant, supergiant or white dwarf
- Use the data to support any conclusion (e.g. size, mass or future)
Worked example
Worked example. Use the diagram below. Describe Betelgeuse using data from the H–R diagram.
Model answer: Betelgeuse has a surface temperature of about 3500 K (between the 3000 K and 4000 K lines, spectral class M), which is cooler than the Sun's 5800 K, so it looks red. Its luminosity is about 100 000 (105) times the Sun's, near the top of the diagram. Because it is cool but extremely bright, it must be enormous (it sits near the R = 1000 line), so it is a red supergiant. Supergiants are massive stars late in their lives, so Betelgeuse will end as a supernova.
Why it works: axes read with units ✔ compared with the Sun ✔ group named ✔ conclusion (size, future) supported by the data ✔
Guided (use the prompts)
2.
Use the diagram.
Sirius A and Sirius B orbit each other. On the diagram, Sirius A sits at a luminosity of about 25 (times the Sun) and Sirius B at about 0.05. Prompt: find both stars first and check that their positions agree with these values. Then divide.
About how many times more luminous is Sirius A than Sirius B?
Explanation
On a log axis, read each value, then divide. Sirius A ≈ 25 and Sirius B ≈ 0.05, so Sirius A is about 500 times more luminous, even though Sirius B is hotter. Sirius B must be tiny: a white dwarf.
Guided (use the prompts)
3.
Use the diagram.
Describe Sirius B using data from the diagram. Which group is it in, and what does its position tell you about its size and its stage of life?
Prompts: (1) temperature from the top axis, with units, compared with the Sun; (2) luminosity from the right axis, compared with the Sun; (3) name the group; (4) hot but dim: what must be true about its size? Where is it in its life cycle?
Model answer
Sirius B has a surface temperature of about 25 000 K (anything from 20 000 to 30 000 K is a fair reading), much hotter than the Sun's 5800 K, so it is blue-white. Its luminosity is only about 0.05 of the Sun's (between the 0.01 and 0.1 gridlines), so it is about 20 times dimmer than the Sun. It sits in the lower left of the diagram, in the white dwarf region. Because it is hotter than the Sun, each square metre of its surface gives out more light, yet overall it is much dimmer, so its surface must be very small: it sits near the R = 0.01 line, about the size of Earth. A white dwarf is the leftover core of a star at the end of its life: it no longer fuses hydrogen and will slowly cool and fade.
Your turn
4.
Use the diagram.
Aldebaran and the Sun are both on the diagram. Which conclusion is best supported by the data?
Explanation
Cool + very luminous → very large → giant. Use the axes and compare with the Sun. Approximate readings are fine: Aldebaran is about 4000 K and a few hundred times the Sun's luminosity.
Your turn
5.
Use the diagram.
A student claims: "Rigel and Betelgeuse are both supergiants, so they must be the same temperature." Use data from the H–R diagram to evaluate this claim.
Model answer
The claim is only partly correct. Both stars are supergiants: they have similar luminosities, roughly 100 000 times the Sun's, near the top of the diagram. But their temperatures are very different. Rigel is about 12 000 K (on the left, spectral class B, blue-white), while Betelgeuse is about 3500 K (on the right, spectral class M, red). Approximate readings are fine, for example 10 000–13 000 K for Rigel and 3000–4000 K for Betelgeuse. Supergiants are grouped by their very high luminosity, and they span a wide range of surface temperatures. Because Betelgeuse is much cooler yet about as bright, it must be much larger than Rigel. Judgement: the claim is not supported. Being supergiants tells us both stars are very luminous, not that they are equally hot.
Exit questions
- Why does the temperature axis of an H–R diagram catch people out?
- A star is hot and very dim. What group is it in, and what does that tell you about its size?
- Describe, in order, how the Sun's position on the H–R diagram will change after it leaves the main sequence.
Show answers
- It runs backwards: hot stars are on the left and cool stars on the right. It is also usually a log scale.
- A white dwarf. Being hot but very dim means it has a very small surface: about the size of Earth.
- Up and right as it becomes a red giant (brighter, cooler); left as it loses its outer layers and exposes the hot core; down to the bottom left as a white dwarf; then slowly down and right as the white dwarf cools and fades.
Want more?
- Crash Course Astronomy #26: Stars
- Crash Course Astronomy #29: Low Mass Stars (the Sun's future)
- H–R Diagram Lab: background reading and the explorer (University of Nebraska–Lincoln)
- Science Ready: the H–R diagram and the life cycle of stars (extension, written for Year 12)