Earth's spheres, energy and a warming world
AC9S10U04 AC9S10I05 AC9S10I08
By the end of this lesson you should be able to
- Name the four spheres and give one example of carbon moving between two of them.
- Explain the difference between the natural greenhouse effect and the enhanced greenhouse effect.
- Draw a line graph from data using TAILS.
- Describe a trend using numbers from a graph, including how the rate of change has changed.
Hook
Same planet, same distance from the Sun. The Moon gets almost exactly the same sunlight as Earth. Yet its daytime surface can pass 120 °C, and at night it can drop below −170 °C. Earth's average is about 15 °C.
Think–pair–share (2 minutes): what does Earth have that the Moon does not? Write down as many differences as you can, then circle the one you think matters most for temperature.
Watch: What is Climate Change? Crash Course Climate & Energy #1 · Crash Course
Four spheres, one system
Scientists split Earth into four connected parts called spheres:
- Atmosphere: the layer of air around Earth.
- Hydrosphere: all the water: oceans, rivers, ice and water vapour.
- Biosphere: all living things.
- Geosphere: rocks, soil and Earth's interior, including fossil fuels (coal, oil and gas).
Energy and matter keep moving between the spheres. Carbon is a good example. A tree takes CO2 from the air (atmosphere → biosphere). The ocean dissolves CO2 (atmosphere → hydrosphere). Plants buried for millions of years become coal (biosphere → geosphere). Burning that coal sends the carbon straight back into the air in a few seconds (geosphere → atmosphere).
NASA's diagram of the fast carbon cycle shows carbon moving between the land, the atmosphere and the oceans. Yellow numbers are natural flows, red numbers are human contributions, and white numbers are the amounts of carbon stored. The flows are in gigatonnes (billions of tonnes) of carbon per year.
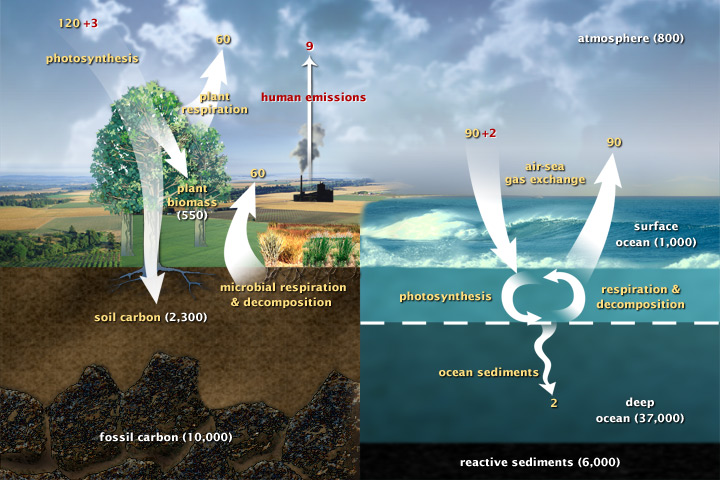
Look closely: find one arrow that moves carbon into living things, and one red (human) arrow. Which two spheres does each arrow connect?
Key idea: carbon moves slowly into the geosphere (millions of years) but burning fossil fuels moves it back out very fast. That is the imbalance behind today's warming.
The greenhouse effect: natural, then enhanced
Sunlight is mostly visible light. It passes through the air and warms the ground and ocean. The warm surface then gives off energy as infrared radiation (heat you cannot see).
Greenhouse gases such as carbon dioxide (CO2), methane (CH4), water vapour (H2O) and nitrous oxide (N2O) absorb some of that infrared and send part of it back down. This is the greenhouse effect. It is natural, and we need it: without it Earth's average temperature would be about −18 °C instead of about 15 °C.
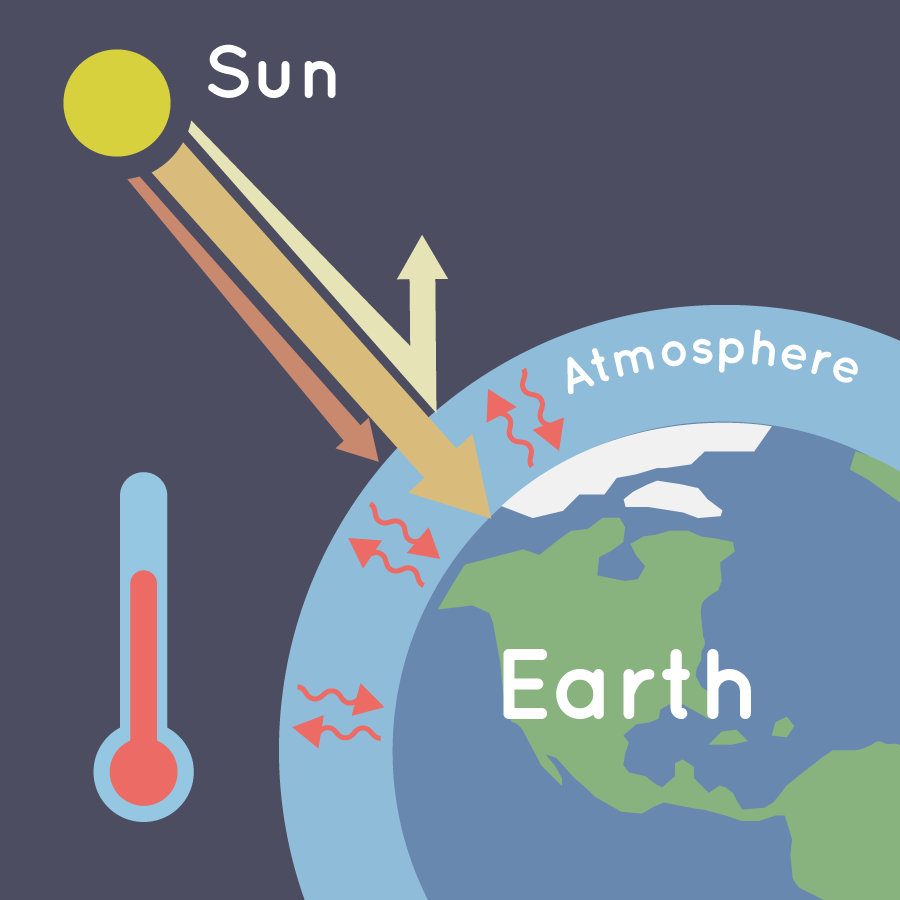
The NASA illustration shows the natural greenhouse effect: greenhouse gases trap some of the heat, so it cannot all escape back to space, even at night.
The enhanced greenhouse effect is the extra warming caused by humans adding more greenhouse gases, mainly by burning fossil fuels and clearing forests. More gas traps more infrared, so more energy stays in the Earth system.
Natural greenhouse effect = keeps Earth liveable. Enhanced greenhouse effect = human-made extra, causing global warming.
The evidence now
- Carbon dioxide: about 280 ppm (parts per million) before the Industrial Revolution. The monthly mean at Mauna Loa, Hawai‘i, was 426 ppm in September 2026. That is about 50% higher, and the highest in about 2 million years.
- Global temperature: 2025 was about 1.43 °C above pre-industrial (1850–1900) levels. The 11 years from 2015 to 2025 are the 11 warmest on record.
- Australia: has warmed by about 1.51 °C since national records began in 1910.
- The ocean: more than 91% of the extra heat trapped by greenhouse gases goes into the ocean (hydrosphere). Ocean heat content reached a record in 2025 for the 9th year in a row, and global sea level was about 11 cm higher than in 1993.
Notice how the spheres connect: gases added to the atmosphere trap energy that ends up mostly in the hydrosphere, which affects coral reefs and fish in the biosphere.
Model answer: the CO₂ graph (open only AFTER you have drawn yours)
Graph the Mauna Loa CO2 data from the activity using TAILS, then describe the trend using data.
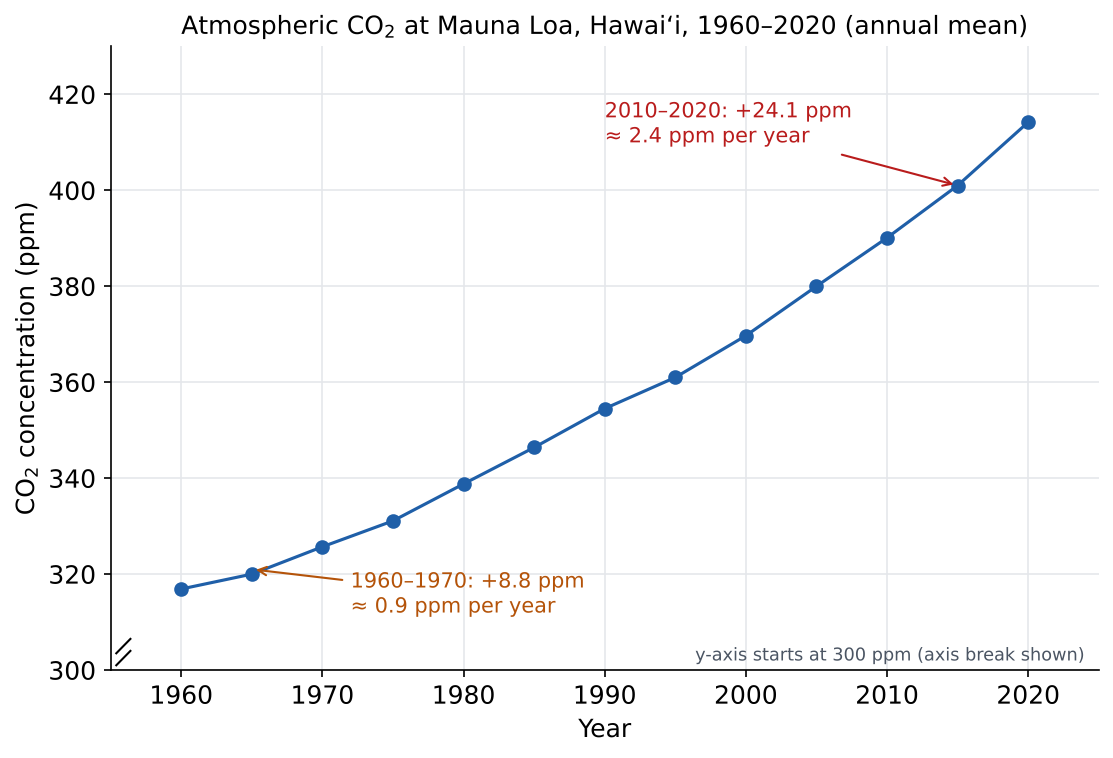
TAILS check: Title says what and where; Axes have year (independent) on x and CO2 (dependent) on y; Intervals are even (every 10 years, every 20 ppm); Labels include units (ppm); Scale fills the page, with an axis break because the data start above 300.
Trend: CO2 increased every five years, from 316.9 ppm in 1960 to 414.2 ppm in 2020, a rise of 97.3 ppm. The rise is speeding up: from 1960 to 1970 it went up 8.8 ppm (about 0.9 ppm per year), but from 2010 to 2020 it went up 24.1 ppm (about 2.4 ppm per year), almost three times as fast.
Explanation: people have burned more and more fossil fuel each decade, moving carbon from the geosphere to the atmosphere faster than plants and the ocean can take it back.
Graphing task: 60 years of carbon dioxide
These are annual average CO2 concentrations measured at Mauna Loa Observatory, Hawai‘i (NOAA). Draw a line graph on grid paper or in a spreadsheet. (The monthly value has kept rising: it reached 426 ppm in September 2026.)
| Year | 1960 | 1965 | 1970 | 1975 | 1980 | 1985 | 1990 |
|---|---|---|---|---|---|---|---|
| CO2 (ppm) | 316.9 | 320.0 | 325.7 | 331.1 | 338.8 | 346.4 | 354.5 |
| Year | 1995 | 2000 | 2005 | 2010 | 2015 | 2020 | |
| CO2 (ppm) | 361.0 | 369.7 | 380.0 | 390.1 | 401.0 | 414.2 |
Use TAILS:
- Title: what the graph shows, where and when.
- Axes: independent variable (year) on x, dependent variable (CO2) on y.
- Intervals: equal steps on each axis (e.g. every 10 years, every 20 ppm).
- Labels: name each axis and give the unit in brackets.
- Scale: use at least half the page. If your y-axis does not start at 0, show an axis break.
Then describe the trend in 2–3 sentences:
- What is the overall pattern? Quote the first and last values.
- Work out the rise from 1960 to 1970 and from 2010 to 2020. Divide by 10 to get ppm per year. Is the rise speeding up or slowing down?
- Use the spheres model to explain why.
Check with the model answer in Learn, block 3, when you are done.
Try it
Open the Waves or Photons screen. Turn the Sun on and wait until the temperature stops changing. Write it down.
- Predict: what will happen to the surface temperature if you raise the greenhouse gas concentration? Why?
- Raise the concentration and wait. What happens to the infrared leaving to space at first? What happens to the temperature?
- Set the concentration to none. Compare the temperature with the starting value. What does this tell you about the natural greenhouse effect?
PhET Interactive Simulations, University of Colorado Boulder, CC BY 4.0
NOAA: Trends in atmospheric CO₂ (Mauna Loa)
Guided example
A student says: "The greenhouse effect is bad. We should get rid of it." Use the spheres model to explain what is right and what is wrong about this.
Show answer
Wrong part: the greenhouse effect itself is natural and essential. Greenhouse gases in the atmosphere absorb infrared from the surface and send some back down. Without this Earth would average about −18 °C, and the hydrosphere would be mostly frozen.
Right part: the enhanced greenhouse effect is a problem. Burning fossil fuels moves carbon from the geosphere into the atmosphere much faster than plants and the ocean can take it back, so more infrared is trapped and the planet warms.
Better statement: "We need the natural greenhouse effect, but we should reduce the extra greenhouse gases humans are adding."
Self-check
How this works
Pick an answer to get feedback. Nothing is saved or sent anywhere; this is just for you.
1.
A power station burns coal. The carbon in the coal moves from which sphere to which sphere?
Explanation
Fossil fuels are carbon stored in the geosphere over millions of years. Burning them moves that carbon into the atmosphere very quickly.
2.
Which statement correctly compares the greenhouse effect with the enhanced greenhouse effect?
Explanation
Natural greenhouse effect = essential. Enhanced greenhouse effect = extra trapping of infrared caused by human emissions, mainly from fossil fuels and land clearing.
3.
Mauna Loa CO2 was 369.7 ppm in 2000 and 390.1 ppm in 2010. What was the average rate of increase, in ppm per year? Round to the nearest 0.1 ppm per year.
Worked solution
Rise = 390.1 − 369.7 = 20.4 ppm over 10 years. 20.4 ÷ 10 = 2.04, which rounds to 2.0 ppm per year. Compare the 1960s (about 0.9 ppm per year): the rise is speeding up.
4.
Which description of the Mauna Loa CO2 data from 1960 to 2020 includes both data values and how the rate of increase changed?
Explanation
A full trend description gives the overall direction, quotes data (start and end values with units), and says whether the change is speeding up, slowing down or steady.
Exam skill: Describe a trend using data, then explain it
What a full answer includes
- the overall direction (increasing, decreasing, no clear change)
- at least two data values with units (usually the first and last)
- the size of the change (subtract) and, if useful, the rate (change ÷ time)
- whether the change is speeding up, slowing down or steady, or any exceptions to the pattern
- an explanation that uses science ideas (cause → effect), kept separate from the description
Worked example
Data: Mauna Loa CO2, 1960–2020 (the graph from this lesson).
Direction: CO2 increased in every five-year step.
Data with units: from 316.9 ppm in 1960 to 414.2 ppm in 2020.
Size of change: 97.3 ppm over 60 years.
Rate: the increase sped up: about 0.9 ppm per year from 1960 to 1970, but about 2.4 ppm per year from 2010 to 2020.
Explanation: humans have burned more fossil fuel each decade, moving carbon from the geosphere into the atmosphere faster than plants and oceans can absorb it.
Guided (use the prompts)
2.
Illustrative data (simplified, based on the pattern in Australian records): average Australian temperature for each decade compared with the 1961–1990 average.
| Decade | 1960s | 1970s | 1980s | 1990s | 2000s | 2010s |
|---|---|---|---|---|---|---|
| Difference (°C) | −0.2 | −0.1 | +0.1 | +0.2 | +0.4 | +0.7 |
Describe the trend and explain it. Use the prompts:
- Direction: is it going up, down or staying the same?
- Quote the first and last values with units.
- Size of the change: subtract.
- Work out the change per decade from the 1960s to the 1990s (3 decades), then from the 1990s to the 2010s (2 decades). Compare the two rates: speeding up or slowing down?
- Explain using the enhanced greenhouse effect.
Model answer
Australian decade temperatures increased in every decade, from 0.2 °C below the 1961–1990 average in the 1960s to 0.7 °C above it in the 2010s, a rise of 0.9 °C. The warming sped up: from the 1960s to the 1990s it rose 0.4 °C over 3 decades (about 0.13 °C per decade), but from the 1990s to the 2010s it rose 0.5 °C over 2 decades (0.25 °C per decade), about twice as fast. This fits the enhanced greenhouse effect: rising CO₂ from burning fossil fuels traps more infrared, so more energy stays near the surface and temperatures rise.
Your turn
3.
Illustrative data (rounded and simplified, based on the pattern in satellite records): Arctic sea-ice extent each September (the yearly minimum), in million km2.
| Year | 1980 | 1985 | 1990 | 1995 | 2000 | 2005 | 2010 | 2015 | 2020 | 2025 |
|---|---|---|---|---|---|---|---|---|---|---|
| Extent (million km2) | 7.7 | 6.9 | 6.2 | 6.1 | 6.3 | 5.5 | 4.9 | 4.6 | 4.0 | 4.6 |
In your book, graph the data using TAILS (optional, but it helps you see the pattern).
Type below: a description of the trend using data, then an explanation.
Model answer
Arctic September sea ice decreased overall, from 7.7 million km² in 1980 to 4.6 million km² in 2025, a loss of about 3.1 million km² (about 40%). The decrease was not smooth: some years were higher than five years before (2000 was 6.3, up from 6.1 in 1995; 2025 was 4.6, up from 4.0 in 2020), but the long-term trend is clearly downward. Explanation: the enhanced greenhouse effect warms the air and ocean, so more ice melts in summer. Less ice also means more dark ocean is exposed, which absorbs more sunlight and causes more warming (a feedback).
Exit questions
- Give one example of carbon moving into the biosphere and one example of carbon moving out of the geosphere.
- In one sentence, explain why the enhanced greenhouse effect makes Earth warmer.
- Where does more than 91% of the extra heat trapped by greenhouse gases end up?
Show answers
- Into the biosphere: photosynthesis (plants take CO2 from the air). Out of the geosphere: burning fossil fuels, or volcanoes releasing CO2.
- Extra greenhouse gases absorb more of the infrared given off by Earth's surface and send some back down, so more energy stays in the Earth system.
- In the ocean (the hydrosphere).
Want more?
- NOAA Global Monitoring Laboratory: Mauna Loa CO₂ trends
- NASA: Evidence of climate change
- Crash Course Climate & Energy #1: What is Climate Change?