El Niño, a warming climate and the road to net zero
AC9S10U04 AC9S10H03 AC9S10I08
By the end of this lesson you should be able to
- Explain the difference between weather and climate.
- Describe what happens to trade winds, ocean water and rainfall in El Niño and La Niña.
- Explain why El Niño years often set global temperature records.
- Explain how a strategy reduces emissions as a cause → effect → goal chain.
Hook
Right now, the Pacific Ocean is running a fever. The Bureau of Meteorology declared an El Niño on 16 June 2026. By October the sea surface in the central Pacific was about 2.1 °C warmer than normal, and forecasters say this could become one of the strongest El Niño events ever measured.
Meanwhile, September 2026 was the second-warmest September on record worldwide, about 1.63 °C above pre-industrial levels, with the warmest sea surface ever recorded for September.
Quick vote: is this caused by El Niño, by climate change, or both? Write your answer and one reason. We will come back to it.
Watch: El Niño: A NASA Perspective · NASA
Weather, climate and El Niño
Weather is the conditions in one place over hours or days: today's rain, tomorrow's wind. Climate is the average pattern of weather over about 30 years or more.
Across the Pacific, steady trade winds normally blow from east to west along the equator. They push warm surface water towards Australia and Indonesia, where it piles up. Warm water heats the air above it, so moist air rises, forms clouds and brings rain to northern Australia. High up, the air flows back east and sinks over South America. This loop of air is called the Walker circulation. Near South America, cold water rises from the deep to replace the water pushed west (upwelling).
This back-and-forth pattern is called the El Niño–Southern Oscillation (ENSO). It has three phases:
- El Niño: the trade winds weaken. Warm water spreads east across the Pacific, and the rising air and rain move east with it. Eastern Australia often gets drier, hotter weather.
- La Niña: the reverse. Trade winds strengthen, even more warm water piles up near Australia, and eastern Australia is often wetter.
- Neutral: in between.
These two NOAA diagrams show the Walker circulation in the southern summer (December–February). In neutral conditions, air rises strongly over the islands north of Australia (the "Maritime Continent"), and also over northern South America and eastern Africa, bringing rain. Dry air sinks over the eastern Pacific.
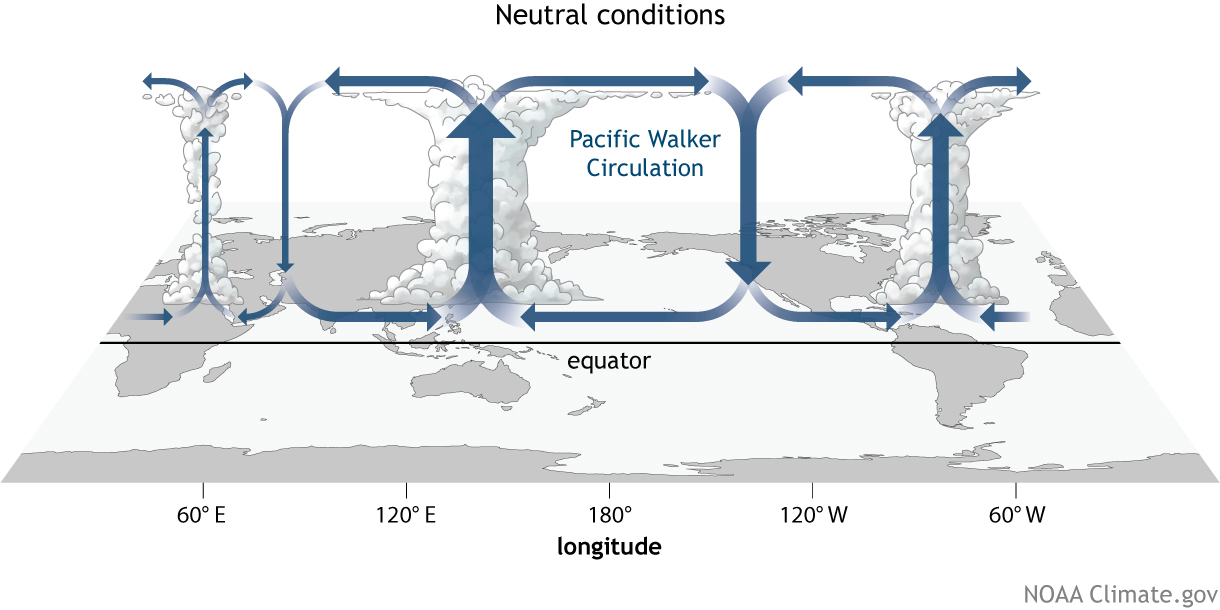
During El Niño, the central and eastern Pacific warm up (shown on the map), so the rising branch shifts east into the central Pacific. Air now sinks over the Maritime Continent and northern South America, so rainfall there is usually below average.

Compare the two: where is the rising (rainy) air in each diagram? Why does that matter for northern Australia?
The 2026 El Niño and Queensland
This El Niño has been building since June 2026. In October, NOAA's measurement of the central Pacific (called Niño-3.4) was +2.1 °C above normal. A strong-to-very-strong El Niño is likely through to about March 2027.
Typical El Niño effects in Australia include:
- a drier winter and spring in the east and south, with hotter days;
- a longer, harsher fire season;
- a later start to the northern wet season (monsoon);
- fewer tropical cyclones, especially near Queensland.
These are odds, not certainties. El Niño makes dry, hot conditions more likely, but it does not guarantee a drought in any particular town. Other drivers, such as the Indian Ocean, also matter.
For Queensland this summer: plan for more heatwave days and a higher fire risk, and do not assume "fewer cyclones" means "no cyclones". One cyclone can still hit.
Natural wiggles on a rising trend
El Niño and La Niña are natural variability. They move heat between the ocean and the air, making some years hotter or cooler than others. They do not add energy to the Earth system overall.
Climate change is the long-term trend. The enhanced greenhouse effect keeps adding energy year after year. So El Niño years sit on top of an ever-higher baseline. That is why El Niño years such as 2016 and 2023–24 set global temperature records, and why a La Niña year now is often warmer than an El Niño year from the 1980s.
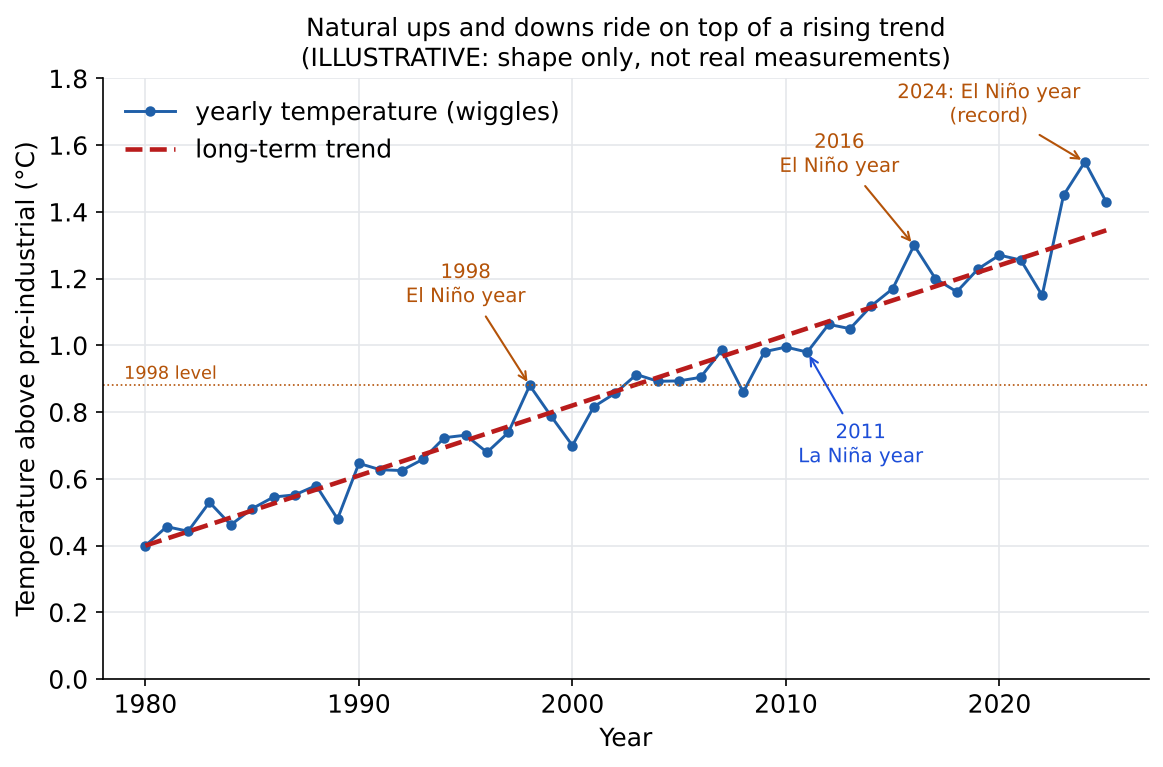
Back to the vote: the record warmth is both: El Niño on top of human-caused warming.
Responses: Australia's road to net zero
Net zero means any greenhouse gases still released are balanced by the same amount removed from the atmosphere (for example, by growing forests). Australia's targets are written into law and policy:
- 43% below 2005 emission levels by 2030;
- 62–70% below 2005 levels by 2035 (set in September 2025);
- net zero by 2050.
The Net Zero Plan has six sector plans: electricity and energy, transport, industry, resources, the built environment, and agriculture and land. Examples range from more wind and solar on the grid to rooftop solar, home batteries and electric vehicles.
Whether a society adopts a strategy depends on more than the science: cost, who pays, jobs, reliability and what people value all matter.
Explaining a strategy: show how it works as a chain: cause → effect → link to the goal. Each step must lead to the next.
Worked example: the heat-pump chain in words
Explain how switching a school's gas heating and hot water to electric heat pumps helps Australia reach net zero.
Cause: the school removes its gas heaters and gas hot-water system and installs electric heat pumps (reverse-cycle air conditioners and a heat-pump hot-water system). A heat pump does not burn anything: it moves heat from the outside air into the building or the water, so 1 unit of electricity delivers about 3–4 units of heat.
Effect: no natural gas (methane) is burned on site, so the building itself stops releasing CO2. The heat pumps use electricity instead, and because they are so efficient, the extra electricity needed is small. As more wind and solar join the grid, each unit of that electricity comes with less and less CO2.
Link to the goal: heating buildings and water is a big part of the built environment's emissions, so this helps meet 43% below 2005 levels by 2030 and net zero by 2050.
Limitation (bonus): while some grid electricity still comes from coal and gas, the saving is smaller, and replacing working gas systems costs money up front.
Cause-and-effect flow chart: your turn
Draw a flow chart with 4–6 boxes and arrows, like the heat-pump example, for this strategy:
A region protects its old forest and replants trees on cleared land.
The first box is the action; the last box links to Australia's goal (43% by 2030, net zero by 2050).
Hints: which gas do growing trees take in, and which process uses it? Which sphere does the carbon move into? Why does protecting old forest matter as well as planting new trees (what happens to the carbon if forest is cleared and burned)?
Extension: add one box at the side showing a limitation or something that could break the chain (e.g. bushfire, drought, how long trees take to grow), and one factor (cost, land use, jobs, values) that affects whether people adopt it.
Swap with a partner. Can they follow every arrow? Is any step missing?
Try it
Check the Pacific yourself. Open the Bureau of Meteorology Climate Driver Update. Find:
- the current ENSO status (El Niño, La Niña or neutral);
- the latest sea-surface temperature difference in the central Pacific;
- what the models predict for the next 3 months.
Predict first: based on today's lesson, what would you expect Queensland's rainfall outlook for summer to show? Then check the BoM long-range forecast.
Bureau of Meteorology: Climate Driver Update · NOAA: ENSO blog and forecasts · Crash Course Climate & Energy #3: Electricity without fossil fuels
Guided example
A friend says: "2026 was really hot because of El Niño, so it's got nothing to do with climate change." Use data and the idea of a trend to respond.
Show answer
Agree with part of it: El Niño does make years hotter. It moves heat from the Pacific Ocean into the atmosphere, so global temperatures go up for a year or so.
But: El Niño is a natural wiggle that comes and goes every few years. It cannot explain a rise that keeps going decade after decade. The long-term trend comes from the enhanced greenhouse effect: CO2 has gone from about 280 ppm to about 426 ppm, and the 11 years from 2015 to 2025 were the 11 warmest on record, including La Niña years.
Conclusion: it is both. El Niño years are hot and they are built on a higher baseline each time, which is why they keep setting records.
Self-check
How this works
Pick an answer to get feedback. Nothing is saved or sent anywhere; this is just for you.
1.
Which statement is about climate rather than weather?
Explanation
Weather = short-term conditions (hours to days). Climate = the average pattern of weather over about 30 years or more.
2.
During an El Niño, what happens to the Pacific trade winds and the warm surface water?
Explanation
El Niño = weaker trade winds, warm water and rain move east. La Niña = stronger trade winds, more warm water and rain near Australia.
3.
The world is slowly warming. Why does an El Niño year make a record hot year more likely?
Explanation
Natural variability (El Niño, La Niña) moves heat around for a year or two. The enhanced greenhouse effect raises the baseline over time. Together they make new records more likely.
4.
A city builds a new electric train line so fewer people drive petrol cars to work. Which is the best explanation of how this can reduce emissions?
Explanation
A full explanation is a chain: cause → effect → link to emissions. Each step should lead to the next. How much is saved depends on how full the trains are and how the electricity is generated.
Exam skill: Explain: cause → effect → link to the goal
What a full answer includes
- names the strategy and what physically changes (the cause)
- states which fuel or gas is reduced or removed, and from which source (the effect)
- connects the steps in order so each one leads to the next (no jumps)
- links to the goal: lower greenhouse gas emissions
- bonus for a top answer: Australia's targets (43% by 2030, net zero by 2050) or one limitation (e.g. depends on how the electricity is made, cost, time)
Worked example
Strategy: switching a school's gas heating and hot water to electric heat pumps.
Cause: gas heaters and the gas hot-water system are replaced by heat pumps, which move heat from the outside air instead of burning fuel (1 unit of electricity → about 3–4 units of heat).
Effect: no gas is burned on site, so the building stops releasing CO2; the electricity it uses makes less and less CO2 as the grid adds wind and solar.
Link to the goal: lower building emissions help Australia reach 43% below 2005 levels by 2030 and net zero by 2050.
Limitation: the saving is smaller while the grid still uses a lot of coal and gas, and the change costs money up front.
Guided (use the prompts)
2.
Rotting food and garden waste in landfill produces methane (CH4), a greenhouse gas that traps much more heat per tonne than CO2. Some landfills now capture the methane through pipes and burn it in an engine to make electricity.
Explain how this reduces greenhouse gas emissions. Use the prompts:
- Cause: what happens to the methane instead of escaping to the air?
- Effect 1: burning methane turns it into CO2 and water. Why is that better than releasing the methane?
- Effect 2: the electricity goes into the grid. Explain how it can reduce the amount of electricity that fossil-fuel power stations need to make.
- Bonus: link to Australia's targets, or give one limitation.
Model answer
Pipes collect the methane from rotting waste before it escapes into the atmosphere. The methane is burned in an engine, which turns it into CO₂ and water. Methane traps much more heat than the same mass of CO₂, so releasing CO₂ instead of methane causes much less warming. The engine also makes electricity. Every unit of electricity the landfill supplies is a unit that coal- or gas-fired power stations do not need to make, so they can burn less fuel and release less CO₂. Bonus: both effects lower Australia's emissions, helping towards 43% below 2005 levels by 2030 and net zero by 2050. A limitation: not all the methane is captured, and keeping food waste out of landfill (composting) is better still.
Your turn
3.
A state government is closing its coal-fired power stations over the next ten years and replacing them with wind farms, large solar farms and pumped hydro storage.
Explain how this strategy reduces greenhouse gas emissions. Include why storage is needed.
Model answer
Coal-fired power stations burn coal, which moves carbon stored in the geosphere into the atmosphere as CO₂. Wind and solar farms make electricity without burning any fuel, so as each coal station closes, the CO₂ it released stops. Wind and solar do not generate all the time (calm days, night), so storage such as pumped hydro saves spare energy and releases it when it is needed. This keeps the supply reliable without burning coal. Because electricity is one of Australia's biggest sources of emissions, replacing coal cuts total emissions a lot. Bonus: this helps Australia towards its targets (43% below 2005 levels by 2030, net zero by 2050). Limitations: the cut only happens if the projects are actually built on time, new transmission lines are needed, and coal-mining communities need new jobs.
Exit questions
- In one sentence each, describe what happens to the trade winds during El Niño and during La Niña.
- Name one likely effect of the 2026 El Niño on Queensland this summer, and explain why it is a likelihood, not a certainty.
- Write Australia's three emissions targets (2030, 2035, 2050).
Show answers
- El Niño: trade winds weaken, so warm water and rain move east, away from Australia. La Niña: trade winds strengthen, so more warm water and rain stay near Australia.
- For example: hotter days, higher fire risk, a later wet season or fewer tropical cyclones. It is only a likelihood because other climate drivers (such as the Indian Ocean) and local weather also matter; El Niño shifts the odds.
- 43% below 2005 levels by 2030; 62–70% below 2005 levels by 2035; net zero by 2050.
Want more?
- Bureau of Meteorology: What is El Niño?
- NASA: El Niño
- Project Drawdown: climate solutions explained
- Crash Course Climate & Energy #3: Can we make electricity without fossil fuels?